Incremental Regression Tree Induction (IRTI)
- MCTS_C = (childRewardRangeSize / globalRewardRangeSize) * MCTS_K)
- MCTS_K = 2.0
- IRTI_SPLIT_NR_TESTS = 100
- IRTI_SPLIT_MIN_NR_SAMPLES = 50
- IRTI_SIGNIFICANCE_LEVEL = 0.001
- IRTI_MEMORIZATION = true


Hierarchical Optimistic Optimization (HOO)
- MCTS_C = (parentActionSpaceVolume / globalActionSpaceVolume) * globalRewardVolume * MCTS_K
- MCTS_K=5.0
- HOO_MEMORIZATION = true
- HOO_V_1 = (sqrt(nrActionDimensions) / 2) ^ HOO_ALPHA
- HOO_RHO = 2 ^ (- HOO_ALPHA / nrActionDimensions)
- HOO_ALPHA = 0.99


.png)
.png)
.png)
.png)

IRTI + HOO + MC + Random + UCT (pre-discretization with 25 splits per depth)


Work
- Regression-based Meta Tree Learning agent (RMTL)
- Hierarchical Optimistic Meta Tree Learning agent (HOMTL)
- Regression-based Sequence Tree Learning agent (RSTL)
- Hierarchical Optimistic Sequence Tree Learning agent (HOSTL)
- Find a better parameter set for HOO for the Six Hump Camel Back function as it is now barely better than UCT with pre-discretization in that environment. I can then generate the same pictures as the ones above.
- Do experiments regarding the multi-step agents and possibly debug / optimize code.
Dear Colin,
ReplyDeletevery good to see these evaluations, I particularly like the comparative ones under point 3. Here a few remarks:
1. It appears you indicate standard deviation or variance in your error bars, please specify, e.g., in the text say mu +- sigma (squared). Make sure you know why you indicate the error bars, and if you want to use confidence intervals:
http://scienceblogs.com/cognitivedaily/2008/07/most_researchers_dont_understa_1.php
http://users.rowan.edu/~everett/courses/Sys_3/docs/11%20Conf%20Int%20&%20Sam%20Size.pdf
2. You Y-axis label still reads error - you just gave the slide the title regret. I would rather label the y-axis regret to avoid confusion with the overloaded term 'error'.
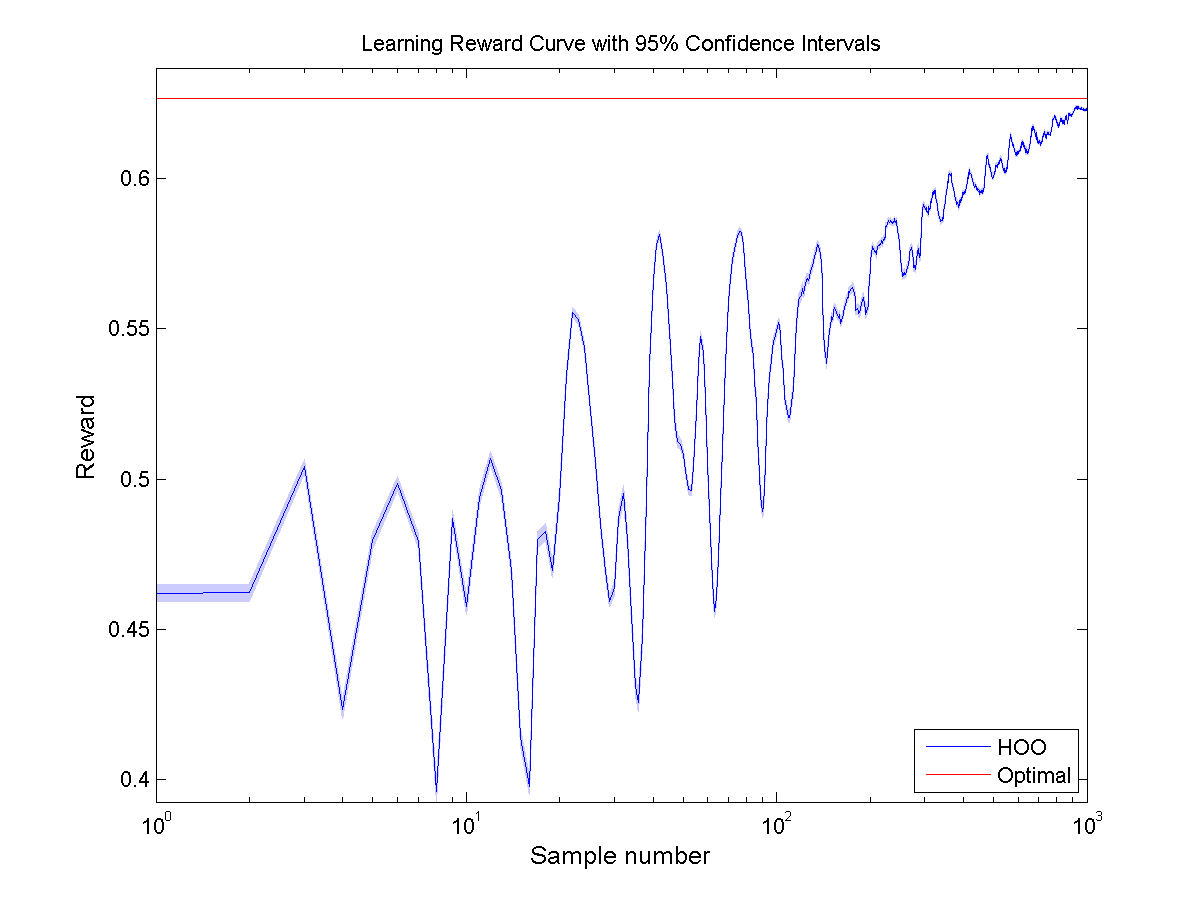
3. GREEDY REWARD CURVE:
- These are averages as well, right? Why not include error bars for performance as well?
- The performance of a random agent does not change as he gets more samples, thus you can replace the noisy line with a straight line. BTW, same applies for the regret curve.
- UCT label should include # cuts/depth
- If you know the optimum, always give a straight line of it. Also, zoom out so the optimum is still visible inside the graph.
- Consider a log scale for the #samples.
4. Behavior: I think Random, MC and Hoo work as expected. IRT and UCT show very interesting averages during learning (dip vs following the sinus shape).
- IRT appears to make the first split only after 100 samples, and then hardly explore the worse leaf at all. Is it possible to set it up to split earlier, but explore both branches more?
- The first 500 UCT samples look deterministic - we can see if it is once you added error bars. Did you by any chance copy half of the sinus return vector? If this is actually the behavior, I would look at the UCT selection strategy. Do you have a fixed depth and do you always select unseen samples rather than following the averages down to a leaf?
Thanks. I will make the changes at home. To clarify some of the remarks already:
ReplyDelete- I set the optimum equal to the top of the graph for the Greedy Reward Curve. Maybe it's nicer to lower this a bit and add a red line equal to the maximum (although this overlaps the other lines most of the time due to the very small difference).
- I designed UCT to also support multi step environments, meaning that for this one step environment is only creates node for one depth. Because I set the DiscretizationResolution to 500, the first 500 samples of the learning curve corresponds to the first visit of all the 500 nodes (at depth 1) and therefore match exactly the shape of the sinus function. After that, it picks the nodes with the highest UCT value each next 500 times.
Dear Colin,
ReplyDeleteI like the new line 'optimum', but I am confused with the colors in the graphs under point 3, where optimum and MC appear to be both red.
I would still prefer Learning and Greedy reward curve with a logarithmic # sample axis, so maybe you can add that?
UCT now picks children in order - I think you will remove these deterministic artifacts if you pick children randomly (given more than one child has not been explored yet). Also, 500 is a very high number. It looks like you have already reduced that (with considerable success in performance), but consider several values and motivate which one you show in your plots.
Any explanation for the sweet improvements of IRTI?
Success, Michael
Dear Michael,
ReplyDeleteThanks for the feedback again! I did a lot of changes to this post again. Above and below the remarks / explanations:
This wrong color was something I noticed for the Six Hump environment but forgot to check it for these already uploaded pictures. Matlab seemed to default the colors when drawing a second plot (even when "holding all"). Anyway, I Fixed it now...
I've also made log plots, althought adding errorsbars made that graph look strange (with few bars on the right and very dense bars at the right). I therefore removed them.
I re-ran the UCT experiment with "shuffled" children. Each simulation a split is done as follows: take the largest split dimension and split this into n number of nodes (in this case 25). Taking the largest dimension is something I also applied to HOO (with visually satisfying results for Sinus/SixHump):
"Example: A typical choice for the coverings in a cubic domain [0; 1]
d is to let the domains be hyperrectangles. They can be obtained, e.g., in a dyadic manner, by splitting at each step hyper-rectangles in the middle along their longest side, in an axis parallel manner; if all sides are equal, we split them along the first axis." - S. Bubeck, R. Munos, G. Stoltz, and C. Szepesv´ari, “Online optimization in x-armed bandits,” in NIPS, pp. 201–208, 2008.
The most important reason of the IRTI improvement is the parameters. Changing only one parameter (out of the big number I've got) slightly changes the performance. Most of the time it is still able to get a good reward each time, but for most settings IRTI gets a bad reward once in 100 runs or so (bringing the average down; probably due to a very unlucky split somewhere). For the current settings IRTI has slightly lower rewards BUT is always to get to that reward. The most important parameter was I though IRTI_SPLIT_MIN_NR_SAMPLES_PER_CHILD (which I rasied to 8), which means it makes split more to the middle of the action space.
Regards,
Colin
Correction / addition to the my last comment about the IRTI improvement:
ReplyDeleteI just remember that the biggest difference should be that the selection procedure takes the maximum reward seen at a node as exploitation value in stead of the mean. This is also the selection strategy that was used by Guy (after looking into the Scala code again)...